Some usefull Matlab Commands as a Summary of Matlab
help : displays a summary about the command that you type after help
for example when you type "help sin" on the command window it will display;
SIN Sine.
SIN(X) is the sine of the elements of X.
clc : Clears the screen
clear : clears the workspace,in other words it cleans all the variable you have used and restore the values of predefined variables such as pi ,exp ...
clear x,y will clean only x and y , you can see the wariables that you have used in the workspace by typing who or whos.
quit / exit : exits from matlab
pwd : means present working directory.it dislays the path of directory that you're currently working in.
The command window can be used as a calculator for example when we write x= (1+1/2) ^2 it will calculate the result and assign it to a variable
in this case the result will be stored into variable x. if we would type only the result would be stored into a matlab variable which is called "ans"
( ; ) : if we put a semicolon after a command that command will run but the result will ot be displayed on the screen this will help us for not waiting the computer to display the long array results.
ls : displays the files and directories stored in current directory
Matlab can also use Complex numbers for example
c1=1-2i ;
c2=2-i;
c3=c1*c2
then c3 will be --- 0 -5i
sqrt(x) : Calculates the square of x
mod(x,y) : calculates x mod y
sin (x ) : calculates the sin value of given x
cos (x ): calculates the cos value of x
2^3 : calculates 2*2*2 ( ^ means power of )
exp(x) : calculates e^x
log(x): calculates lof value of x
abs (x) : calculates the absolute value
angle (c1): calculates the angles for complex values
conj(c1) : cclculates the conjugte of a given complex ( conjugate of 2-3i is 2+3i)
imag(c1): gives the imaginer part of complex number c1
real(c1) : gives the real part of complex number c1
floor (x) : gives the largest int value less than x ,if x is alreay an int its value doesn't change.
ceil (x) : gives the smallest int value greater than x,if x is alreay an int its value doesn't change.
round : round the number to the nearest int value
factor(x) :gives the prime factor
sign(x) : is the signum function ,returns o if x=0 reurns -1 if x<0 returns 1 if x>1
Arrays:
There are several ways of creatin arrays and these are
x=[ 1 2 3 4 5 6 7 8] 1x8 array
y=[ 1 2 3 4 ; 5 6 7 8 ] 2x4 array semicolon means the second row is being entered
z=[1 2 3 4
5 6 7 8] 2x4 array y=z here ,dhere is no differance
z=y= 1 2 3 4
5 6 7 8
x= 1 2 3 4 5 6 7 8
x=1:0.1:100; // will create an array begining from 1 up to 100 steping by 0.1
a=linspace(0,2*pi,30) // will create a linearly equally weighted array from 0 to 2*pi, and the number of elements will be 30
there are two types of multiplications between 2 matrix
for example
x=[ 1 2 3 4]
and
y=[ 2 3 4 5]
x*y means normal matrix multiplication and the matrix dimensions must agree
for example 2x3 matrix ca only be multiplied by a matrix with dimensions 3x2
and there's a dot multiplication that ,it will multiply 2 arrays element by element
for example if want to calculate x .* y dimesnsiuns of x and y must be exactly same
if
x=[ 1 2 3 4]
y=[ 2 3 4 5]
z=x*y
??? Error using ==> *
Inner matrix dimensions must agree.
but
z=x.*y
z= 2 6 12 20
array can also be multiplied,devided by or substructed,added from / to real numbers
y= x*3
y= 3 6 9 12
size: size(x) gives us the sizes of array x
ones(a) : creates a x a ones array
zeros(a) : creates a x a zeros array
Functions and m files:
When you select new --> m file from file menu a new window will be opened and you write your function or commands here
you may write the commands that you manually write to the console here and save the file giving a name,then when yo type the name of this file
all commands written in this file will automatically run.(like batch files in dos) But the file must be saved in the directory that you're currently working in
you may chance the current directory by using set path option in file menu or you may also ude cd ,pwd ,ls commands in console to manually go to any
directory.
But we are also going to write some functions and will use functions in the exams.Now lets see how a function can be written.
function y=evaluate(x) // y is the outut parameter of the
function if there are several output parameters we show it "function
[x,y]=evaluate(a)"
y=1/2.*x;
// y is calculated and output is returned by y
function plot_the_y(y); // this is another function that plots
the graph of y which is
plot(y,'+b');
plot_the_y(exaluate(x)) will use both f these functions
and a function can be called in another function
Ploting Graphs
We have 2 functions to plot a graph these are stem(for discrete signals) and plot (for continious signals)
their usage are not very different and when you write "help plot" you will see a detailed discription for these.
plot(t,y,'b.')
t will be for x axis and y for y axis, it means the graph will have the corresponding t values for t values at x axis
but if we write the command as
plot(y,'b.')
there will be integer numbers at x axis and corresponding y values for that integers at y axis.
here b means drow the graph in blue color and "." is put after "b" to indicate that we want to put dots at the top of discrete points of graph.
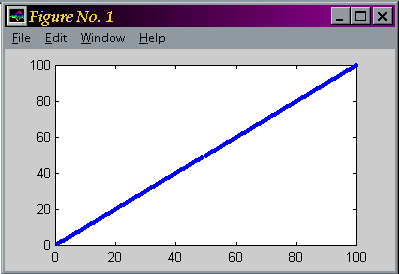
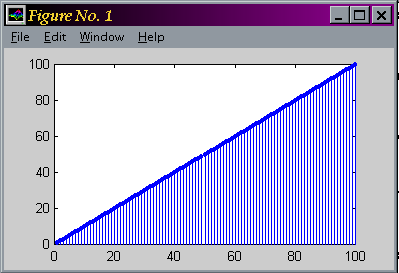
x=1:0.1:10; // will create an array begining from 1 up to 100 steping by 0.1
plot(x,'b.')

stem(x,'b.')

We can write titles, text and axis labes of the graphs,using title,xlabel,ylabel and text commands
Title : title ('this is the title of mygraph')
xlabel: xlabel ('here is xlabel of my graph')
ylabel :ylabel (here is ylabel of my graph')
text :text(10,20,'Ali'); // it will write Ali to the location where x value is 10 and yvalue of 20
hold on : hold on command allows you to plot a graph onto another one without cleaning the previous one
you can close this property by typing hold of.
grid on: it will displays the grids on figure and can be closed by typing grid of